

Today we look at the latest data released by the RBA and ABS to 30 September 2013 to tryand determine the overall economic position of the nation.
In economics we usually clutch upon GDP growth as the definitive figure determining the health of a nation. It represents the total dollar value of all goods and services produced in an economy over a year, and is an easy comparison with other economies. It basically indicates how much an economy has grown.
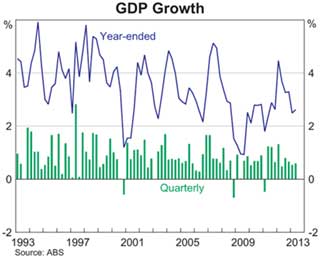
Australia’s GDP growth is at 2.6% p.a. When compared with the various highs over the last 20-year period, it is needless to say that this is measly.
However when compared to the GDP’s of other advanced economies like the US, EU and Japan, as shown below, Australia does not seem to be faring so bad. The EU is experiencing negative growth, the US is hitting just above 2% and Japan just below. These figures are not overwhelmingly positive but are a great improvement on the 2008 figures.
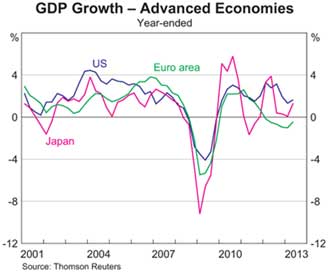
This comparison should be taken with some caution however. It is important to remember that each of these countries were severely affected by the GFCwhile Australia managed, by policy or position, to weather the storm. This would suggest that the current GDP data for Australia does not bode well for growth into the future.
Where is the growth coming from?
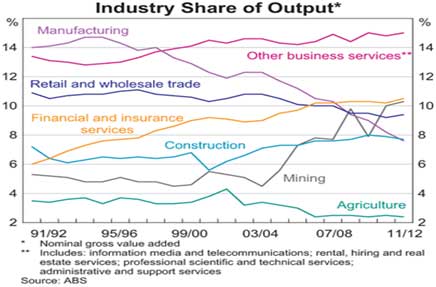
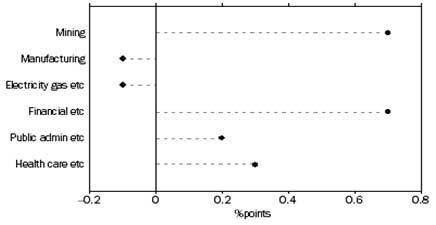
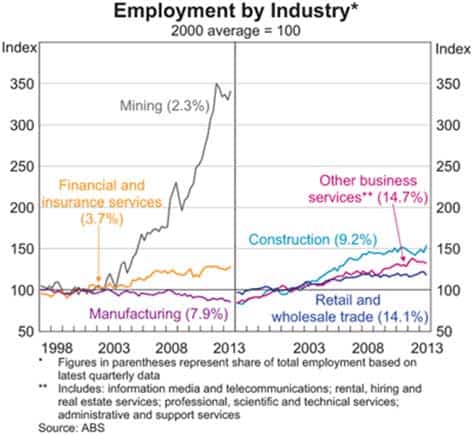
The RBA indicates in the graph below that the industries contributing the most to the share of output are business services, financial services, mining, retail and wholesale trade. What is of more interest considering the relatively low overall growth is which industries are increasing their contributions. The strongest increases are from financial and insurance services and the mining sector, which islargely to be expected and mirrors the largest contributors to growth between June 2012 and June 2013, as the second graph shows. Mining and agriculture are both maintaining their downward trend, suffering badly from a high AUD exchange rate.
Selected Industries Contribution to Growth June 2012 to June 2013
However useful this data is in understanding the current makeup of the Australian economy, it is a bit misleading looking at it from today’s context. It is now largely accepted that the mining investment boom is over or nearing its end, which means that we need to look to other industries to boost growth into the future. Even the Governor of the RBA, Glenn Stevens, recognized this when he said that growth would continue to be below trend into the near future “as the economy adjusts to lower levels of mining investment.”
The graph below indicates the dramatic decrease in investment in the mining industry. If this is true, the Australian economy will be significantly shaken.
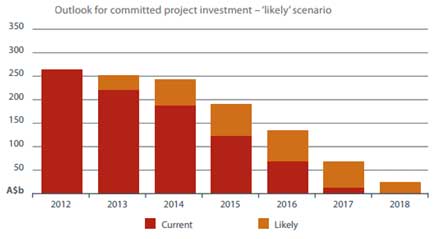
The question the new government must addressis how to energise and incentivize the Australian economy to boost GDP levels, to ensure growth after the mining decline.
The still soaring dollar
The graph below shows the changes the dollar has experienced against the $US, EURO and YEN since 1995. It is evident that the value of the $AUS has increased against all of these currencies since 2008. This has had the serious effect of undermining the competitiveness of the Australian exporting industry, particularly manufacturing and agricultural sectors as outlined above.
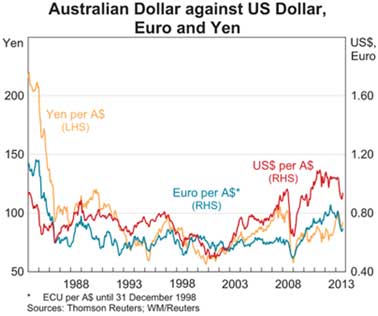
The Australian exchange rate experienced rapid fluctuations in recent weeks. These fluctuations were in direct reaction to the Fed’s to-ing and fro-ing over whether to begin tapering the quantitive easing agenda they have pursued since late 2008.
The June monthly rate fell from .9037 to .8947 in August, only to be lifted considerably to .9309 in September. The data released on October 2nd shows that the $AUD/$US sits at 0.9369. After almost 3 years of an uninterrupted strong $AUD, this is a mild reprieve for Australian exporters
Jobs, jobs, jobs.
Over the past year the Australian unemployment rate has increased steadily. The data released by the ABS on 12th of September indicated a further increase in the unemployment rate. The data indicated a total number of 712,400 people out of work, which amounts to a rate of 5.8%.This is a 0.5 ptsincrease from the previous year.
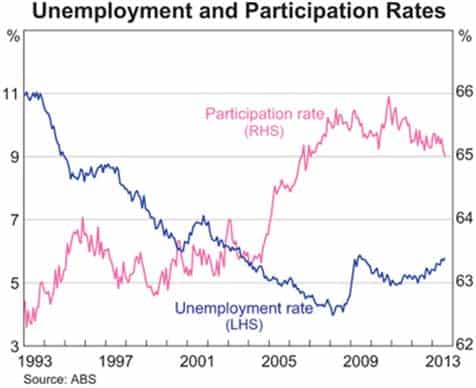
Relative to the level of unemployment rates of other developed countries, Australia does not look so bad. America was sitting at a rate of 7.3% in August. England was sitting at 7.7% in September. Italy has the unfortunate challenge of dealing with the August high of 12.2%, while Spain’s September figure sat at an enormous 26.2%. The Spanish Prime minister described this extraordinary figure as the ‘best jobless data’ Spain had seen for many years.
Increasing unemployment is not a good indicator of the health of an economy because it shows that there is insufficient investment to create jobs. Increasing unemployment inevitably becomes a strain on government, as tax revenues go down while welfare payments increase. In a political environment committed to creating a budget surplus, unemployment must be addressed. The increase in Australian unemployment shows that the economy must grow more than the current 2.6% p.a to ensure that a more manageable unemployment rate can be reached.
The graph below shows where most employment has come from and where job losses have occurred over a fifteen-year period. Manufacturing is in obvious decline with retail and wholesale suffering recent losses.
The breakdown into state unemployment rates, shown below, highlights the real problems areas to be Tasmania and South Australia.
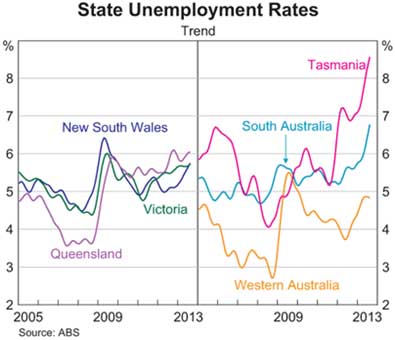
What this data indicates is bitter sweet. While there is employment growth in some areas of the economy, the overall story is negative. Westpac has forecast that unemployment will increase to 6.0% by year-end and reach 6.4% over the course of 2014. With the private industry seemingly reluctant to invest, it is the role of the new government to either create incentives for investment or undertake their own initiatives to do this.
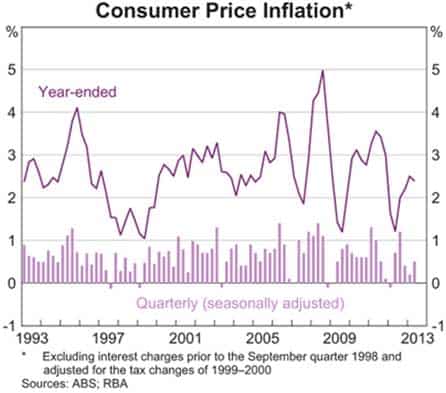
Unlike the increasing rate of unemployment, there is not much to say about inflation.Except to say that it is sitting comfortably within the RBA’s target range of 2-3%. This should create a comfortable environment for investment.
Monetary policy
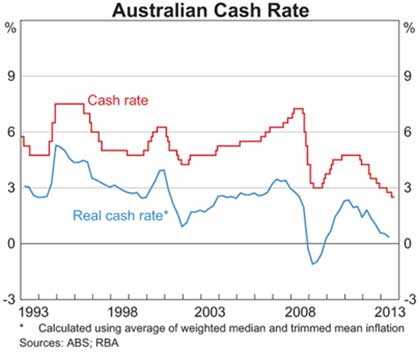
At its latest meeting on 1 October the RBA kept the cash rate steady at 2.5 %. Governor Glenn Stevens said that “…the easing of monetary policy since late 2011 has supported interest-sensitive spending and asset values.” He indicated that while the pace of borrowing by households had been meager, recent signs have shown increased demand for finance by households, which could have positive impacts on house values and the construction sector. The RBA clearly recognizes the structural difficulties the Australian economy is currently undergoing. However the stay on interest rates indicates their wariness to encourage the wrong kind of investment.
Considering the expected lackluster growth into the future, the question swirling around the business news in recent weeks is whether the RBA will cut the rate again in the near future.
Debt and savings
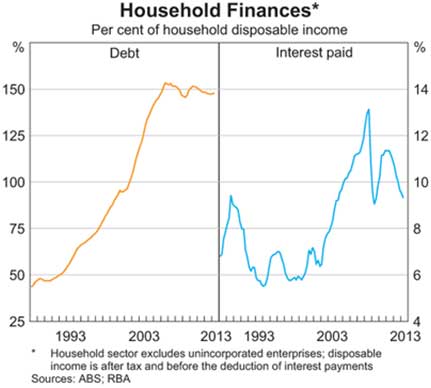
The low interest rate environment has been a breath of much needed air for the highly indebted Australian households. Current levels of debt are at historic highs of 150%. However, as the graph below shows this high level was first reached in 2005 and has effectively plateaued since then. This suggests that households have reached a limit of how much debt they are willing to take on.
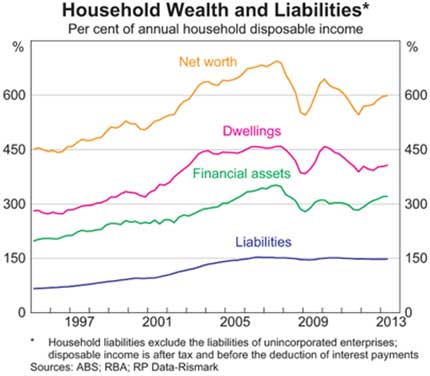
The view over the longer term is slightly different, with the graph below revealing that household debt has trebled since the late eighties but interest paid, due to historically low interest rates has not increased anywhere near as much. This is a key risk factor for the Australian economy as households and businesses become accustomed to artificially low interest rates and establish investment and loan positions which are not sustainable when rates inevitably return to more normal levels.
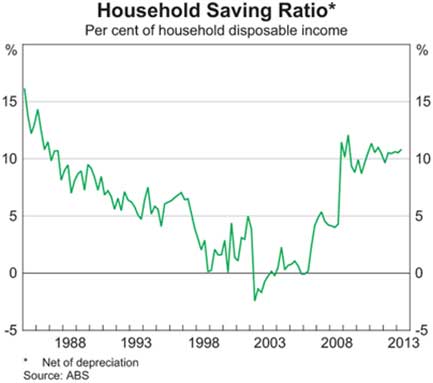
Interestingly the saving rate of householdshas increased substantially since 2001, from negative figures to a positive 11%.
The property market
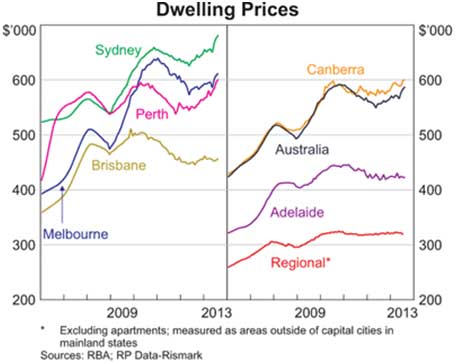
As we reported last week, property prices across the country have been experiencing a recent boost. Sydney and Perth are leading the charge in increases in property prices as shown in the graph below. The only anomaly in this story is Tasmania, not on the graph, which has experienced negative growth in the values of homes.
The RBA data shows that the housing lending rates of banks has been progressively decreasing since 2011. This mirrors the RBA’s expansionary monetary policy during this period.
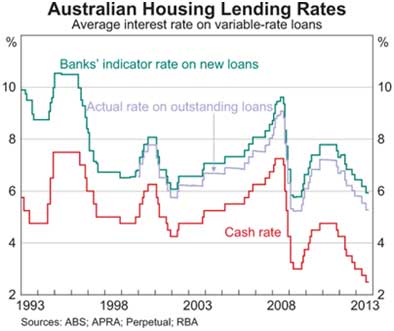
This decrease in lending rates has created an environment where people are more willing to take on debt to finance the purchase of a home. The latest ABS data shows that building approvals were up 7.7% in the 12 months to August. The increase over the year suggests that there will be an uptick in construction activity in the second part of the year.
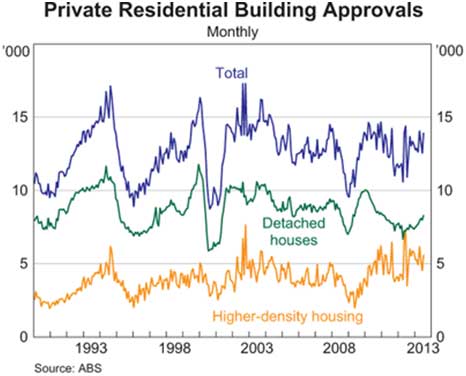
This data is positive news for an economy seemingly in decline. The green shoots of the housing sends an encouraging message into the economy that will have flow on effects in construction, real estate and banking.
Stock markets
The world and US stockmarkets suffered massive losses when the GFC struck in 2008 in response to a US housing bubble and liquidity crisis in international banking sectors.
If one looked at nothing but the graph below, you would be forgiven for thinking the GFC was well and truly over and a full recovery had occurred. The US S&P index ended the September quarter on all time historical highs, fueled largely by the US Fed maintaining an artificial (money-printing) stimulus package to the tune of $85 billion per month.
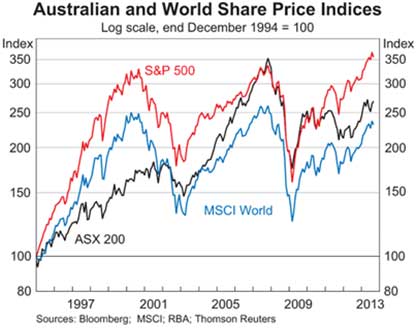
The Australian ASX 200 closed at 5,219 on 30 September 2013, up 8.7% for the quarter and 18.9% since this time last year. The index is still however 23.6% below its high of 6,829 achieved pre-GFC in November 2007.
Australian shareholders are obviously holding very different views than their US counterparts. On the surface it seems very difficult to argue against a bubble in the US market.
What does this all indicate?
Australia is in a situation unlike other developed economies in the world. Having fared extraordinarily well during the GFC, Australia is now beginning to feel the brunt of a slow down in the economy.
This is undoubtedly connected to the revision in expectations about the mining boom and negligible investment in the non-mining sector. As we reported in mid September the government and the RBA have their work cut out for them to maintain reasonable levels of growth, stave off further increases in unemployment and boost business confidence to invest in the non-mining sector. While the green shoots of the housing sector is an encouraging sign, there is need for more long-term investment that will boost the economy and achieve a sustainable recovery into the future.


