

Global Debt: Australia vs The World
Global debt levels are at all time highs. Governments, corporations and individuals are dealing with mounting debt problems in different ways on both domestic and international comparisons. How do they compare? Have they been or will they be successful? What does this mean for the Australian economy?
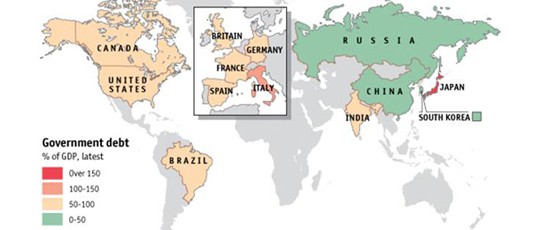
Current Snapshot of Government Debt Levels
The world’s most highly indebted developed nations are represented below. It is worth noting Australia’s relatively strong position when compared to its Organisation for Economic and Cooperative Development (OECD) counterparts. Australian government debt is 26% of GDP. That is not to say that Australia doesn’t have a significant debt issue to deal with, this will be discussed later in the article.

Cleary Japan is the stand out, and they are also on their own in terms of policy approaches. Whilst the rest of the world is focusing on spending cuts and increasing taxes to cut debt, a method referred to as “austerity measures”. Japanese PM Shinzo Abe, using what has been termed as “Abenomics”, is attempting to spend Japan’s way out of trouble by recently announcing a USD$100 billion Bank Of Japan (BOJ) stimulus package. The aim is to create 600,000 jobs and add 2% to GDP, however the only certainty is it will increase Japan’s extremely high debt levels even further.
The EU’s government debt now sits at 94.9% of GDP. In this region “austeri ty” is the common theme, enforced by the European Central Bank and the International Monetary Fund in exchange for rescue packages. It should be noted that for all the press
coverage given to these bailouts, primary countries on the receiving end (Greece, Ireland, Portugal and Cyprus) account for only 6.5% of Eurozone GDP, whilst Germany, France and Italy (which account for 65% of GDP) continue to benefits from a low Euro, boosting international competitiveness for their exports.
Spain remains the tipping point in the region. Whilst accounting for a large 1 2% of Eurozone GDP, its public debt relative to GDP was only 60% in 2010 (less than Germany and France at the time). Debt was largely avoided by ballooning tax revenue from a housing bubble, which helped accommodate a decade of increased government spending without debt accumulation. When thebubble burst, Spain spent large amounts of money on bank bailouts, including 19 billion euros to Bankia in May 2012 on top of a previous 4.5 billion euros bailout. During September 2012, regulators indicated that Spanish banks required 59 billion in additional capital to offset losses from real estate investments, and governments deficits continue to accrue at ever increasing levels. Spain became a prime concern to the Euro-zone when interest on its 10-year bonds recently reached the 7% level and it faced difficulties in accessing bond markets. This led to a Eurogroup financial support package of 100 billion euro. Government debt is now expected to peak at 110% of GDP in 2014.
There are some clear parallels from this experience which should ring alarm bells for Australian context…
The adoption of austerity measures has been a politically fraught path for many administrations in the region. Greece was initially the most high profile case where PM George Papandreou resigned his priministership in the face of large public protests and civil unrest. Spain and Portugal have also struggled to have austerity measures approved by their parliaments. Most recently French President Francois Hollande raised tax rates on the wealthy to as high as 75% of income, prompting high profile French citizens such as actor Gerard Depardieu and Frances richest man Bernard Arnault (of LVMH fame) to renounce their citizenship.
In the USA there is bipartisan political support for the reduction of the government debt. There is however political acrimony between Republicans & Democrats over how to get there. This is hampering the legislative reforms needed to reduce debt over the long term. The political paralysis is also causing disruption to global markets as the US congress lets the country float dangerously close to the fiscal cliff. A criticism of Barack Obama’s and John Boehner’s handling of the negotiations has been that they are merely “kicking the can down the road” and deferring the hard decisions until a later day of fiscal reckoning.
Global Household Debt
The world’s most highly indebted developed nations are represented in the graph below. Previously we saw that Japan’s government debt as a percentage of GDP is the highest in the world, however Japanese households are in a relatively better position. Britain & France are shown to have high household debt levels in conjunction with high government debt levels. This makes them susceptible to economic shocks, and more recently the target of international hedge funds with shorting strategies.
It is also worth noting the countries with the highest levels of economic growth i.e Brazil, India, Russia, China (BRICS) have the lowest household debt levels.

Historic Trends
Below there are three time series graphs that show trends in government, household, and corporate debt levels of the USA, Japan and the United Kingdom since 1975.
The long term trend borne out of all three graphs is the explosion in overall debt levels since the 1970’s and 1980’s.

The long term story in the USA is a doubling of overall indebtedness since 1975. The increase has been across all sectors and each sector has remained proportionally similar over the time period. A recent pullback from the peak levels of 2009 is evident, however debt levels remain at all time highs. Warren Buffet in a recent interview told Bloomberg: “The banks will not get this country in trouble, I guarantee it…. our banking system is in the best shape in recent memory.” Such a respected view is difficult to disagree with, but there seems to be common agreement that the 30 year debt fuelled growth binge is going to take a generation to get back under control, is assuming all parties are willing to start now.

In Japan debt has doubled since the 1980’s. What really stands out in this graph is the fact that government debt has expanded the most, quadrupling since the 1980’s. Corporate debt has grown only marginally and in fact shrunk as a proportion of overall debt since the 1990’s. Short term Japans overall debt levels look set to continue their rise as the BOJ begins to stimulate the economy to the tune of USD$100 billion. The Japanese situation clearly rests at the Government level, but is proving difficult to arrest as its population ages and lives longer (increasing health care and pension costs), and its workforce shrinks (reducing the tax base and national GDP). These are structural long term issues which require fundamental shifts in Japanese government policy.

British debt levels are now approximately 250% of what they were in 1987. This increase is largely due to the enormous increase in the debt of banking and financial institutions. A more leveraged financial sector means a financial sector more susceptible to economic shocks such as the global financial crisis. Over the long term the proportion of financial debt to total debt has markedly increased from 25% of total debt to 45%. Short term we can see a slight pullback in overall debt from the levels of 2010 as austerity measures begin to have an impact.
The Australian Case
Despite Australia being in a strong position fiscally relative to its OECD counterparts we are not in fact in a strong position by our own standards historically. The graph below reveals that current Australian debt levels are similar to that of the years of 1985 and 1986 when Paul Keating made his famous “banana republic” comment to John Laws. Back then the same level of government debt was viewed by the markets and media as a huge problem, why is it not now? Our view is that it should be. The levels of debt we are seeing now preceded “the recession we had to have” and high interest rates seen in Australia in the early 1990’s.

Components of Australian Debt Over Time
The graph below shows the trend of Australian household, corporate, and government debt over time.

The Australian governments debt position is, as Wayne Swan continually reminds us “the envy on the developed world”. However what he fails to mention is that our level of household debt is certainly not to be envied. Looking at the graph above clearly reveals a nearly 600% increase in household debt in the Australian economy since 1990. Short term we can see a reduction in corporate debt since 2008 but an increase in government debt over that period as well.
The two graphs below elaborate further on Australia’s household debt problem. Firstly debt affordability compared to household disposable income has seriously deteriorated since 1990, largely driven by growth in debt fast outpacing growth in income. The second graph is of even greater concern, showing that over the same period household debt growth has rapidly exceeded growth in household assets. The domestic debt binge has been directed by households towards consumption rather than investment. This may be very positive for current sales of flat screen TV’s, however it does nothing to aid repayment of the debt, and has really only been a brining forward of future consumption. Australian households remain highly geared and stretched in their ability to repay, resulting in a large drag on future consumption as households are forced to deal with tackling accumulated debts.


This new era of debt consolidation is not only of concern for the retail sector in terms of reduced sales, but is of particular importance to those in the mortgage industry as financially distressed households will inevitably lead to an increase in mortgage arrears and defaults. The Australian banking sector is highly exposed to Australian households, both via direct loans and loans to businesses which are reliant on household consumption. The strength of the Australian banking sector is therefore directly linked to the strength of the Australian household. As outlined above, this is not a good sign for Australian banks.
Conclusion
The world’s developed economies have to find the right policy mix to simultaneously stimulate economic growth and bring down high government debt levels. The European Union is adopting austerity measures, whereas the BOJ is attempting to spend its way to economic recovery. In the USA, it is Barack Obama’s intention to raise taxes and reduce spending but an acrimonious political situation there is stymieing major reforms. The bottom line however is that all of these regions are continuing to run government budget deficits and so none are reducing debt yet.
Global household debt levels tell a slightly different story. The USA, Eurozone Japan and England may all have higher government debt levels than Australia, but they also all have lower household debt levels than Australia. This comparative strength in Australian government debt levels is also no reason for comfort, as in absolute terms, the Australian position is weak by our own historical standards and must be dealt with by the government. The key risk in the Australian economy is a still inflated property market, buoyed by very high levels of household debt (compared to assets) and household gearing (compared to disposable income to service the debt).
This makes the Australian economy extremely vulnerable to any external shocks that may cause a rise in unemployment, lower incomes, or higher interest rates. Any falter in the property market would have serious flow on effects to the Australian banking sector, and whilst the Australian government continues to accrue higher debt levels, it reduces its ability to assist in any required bail outs. This scenario is uncannily similar to the Spanish case, however Australia has no ability to rely on a backup like the Eurozone bail out scenarios. The island economy is clearly in a fragile state, and we suggest a false sense of security. Immediate measures must be adopted to reduce household and government debt levels, and investors should tread with caution until that occurs.


