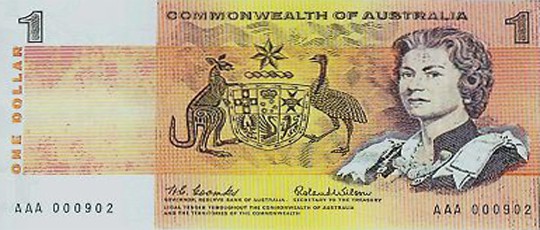
The AUD reached parity with the USD for the first time in recent history in 2010. It was a big deal and newspapers ran with headlines like “Float on: Dazzling Dollar Hits Parity with Greenback”(Sydney Morning Herald, 16 Oct 2010). Many observers commented that it was only temporary and that the AUD was overvalued, however two years have now past and the AUD is currently buying USD$1.04.
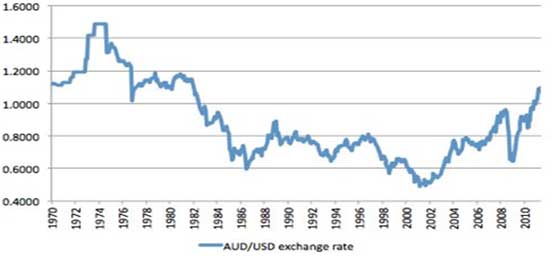
The term recent history is used because since the 1970’s the AUD has spent as much time at or above parity as it has below (as shown below).
Low unemployment, stable economic growth, a relatively strong Federal Budget position, low inflation, high terms of trade and relatively high interest rates are all factors keeping the Australian economy strong and the AUD high. Other factors include the increasing appetite of foreign countries for Australian government debt and the AUD developing into a reserve currency. These factors all appear here to stay and as a result so is the strong AUD.
Terms of Trade
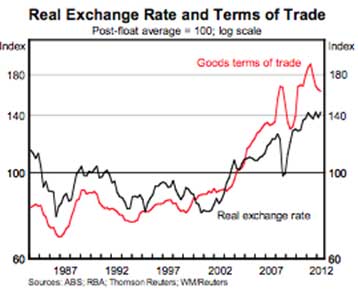
Historically the AUD exchange rate has been linked to the price of Australia’s main exports: farming and now mining. Demand for exports of coal and iron ore are expected to remain strong as the Chinese economy continues to grow at high rates, with the most recent forecast for 2013 GDP growth announced by outgoing Chinese premier Wen Jiabao at 7.5%. These exports in turn drive Australia’s terms of trade results, and the clear link between this and the AUD is shown below.
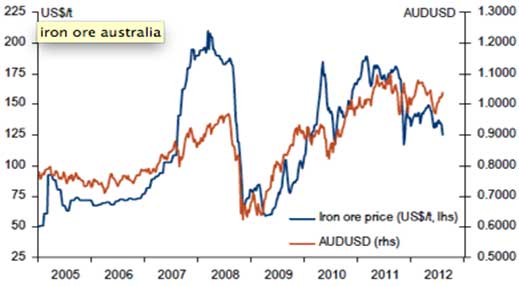
By far the main component of Australia’s current terms of trade success is iron ore, and the graph below again shows the strong link between the AUD and the price of iron ore. Global iron ore prices are currently being driven by Chinese demand caused from industrialization and urbanization of the world’s largest population and second biggest economy.
McKinsey & Co forecast that by 2030 China will have 1 billion urban residents, that is an increase of over 300 million from where they are now (or to put this in perspective, almost 65 cities the size of Sydney). This will ensure that strong Chinese demand for commodities continues over the coming decades, with resultant support for iron ore prices, Australian terms of trade and therefore the AUD.
Interest Rates
Since the GFC The Reserve Bank of Australia (RBA) has consistently kept the cash rate higher in Australia than has been done in other developed nations. The graph below shows the difference in 90-day cash rates of Australia vs other nations. The official RBA cash rate is currently 3%, equal to the level immediately following the GFC, and it is hard to see the RBA dropping it any further.
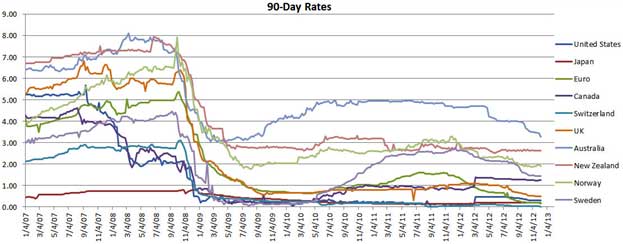
In fact inflation appears to be past its low point (currently at 2.25%) and parts of the non-mining economy are responding to earlier cuts. The drivers for lower rates in 2012 may disappear in 2013. The RBA was the first major central bank to lift interest rates in 2009 from “emergency lows” once it became clear that those low rates were no longer required and the global economy recovered. Recent comments by the RBA governor Glen Stevens such as “there are signs that the easier conditions are having some of the expected effects” in boosting the non mining economy, have indicated the current easing cycle may be finished and the RBA has left rates unchanged for two months running. On Monday 11 March the three year bond yield rose above the RBA cash rate for the first time since July 2011 indicating investors are not expecting further cuts to the official cash rate.
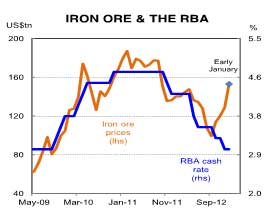
The cash rate has also historically had a curious link to iron ore prices. As shown below however that link has recently decoupled. Goldman Sachs forecast another year of high iron ore prices with a 2013 forecast of $144 per tonne and a forecast of $126 per tonne for 2014. With the downward trend in interest rates now no longer forecast, this decoupling is also expected to come to an end.
Strong GDP Growth & “Safe Haven” Status
Australia was one of the only developed nations in the world to avoid a recession after the GFC. Unemployment remains a lows of 5.4% and the Treasury Departments’ latest forecast is for growth to be 3% this coming year. Conversely Europe is still struggling through its debt woes, the US whilst improving is only forecast to grow 2% and the full impact of the Sequester remains to be seen.
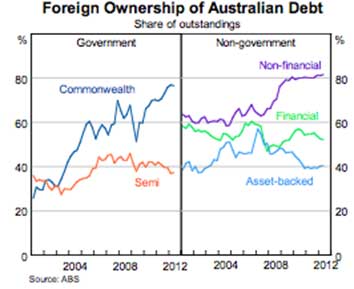
This relative economic strength contributes to the AUD developing status as ‘safe haven’ currency when compared to most of the developed world. This has encouraged capital inflows and will continue to do so. One consequence of this is an increase in foreign ownership of Australian debt, which has now become almost 80% held by foreigners, up from less than half that a decade ago. The graph below illustrates this large increase in foreign ownership of Australian Government Securities.
The safe haven status has also contributed to the IMF’s recent decision to add the AUD to the IMF Reserve Currency List in the first half of 2013. This is the list of currencies that are included in the IMF’s Composition of Foreign Exchange Reserves survey which is conducted quarterly. The only other currencies currently on the list are US Dollars, Sterling, Yen, Euro and Swiss Francs. This is likely to further add to central bank buying of the AUD that has occurred over the last few years.
RBA Model Testing
In response to Freedom of Information requests, the RBA recently released modeling it had completed in response to concerns that the AUD was substantially overvalued. The three models prepared (refer below) produced a range of results:
Model 1: using data since 1971, concluded the A$ is 19-23% undervalued;
Model 2: using data since 1986, concluded the A$ is 4-6% overvalued; and
Model 3: using data since 2002, concluded the A$ is 12-13% overvalued.
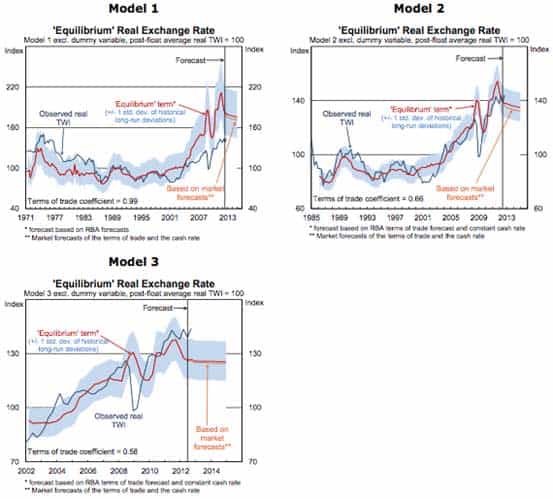
The RBA’s preferred approach was Model 2, which indicated an overvaluation of around 4% in September 2012, and has more recently been updated by the RBA to indicate an overvaluation by about 7% (which is around one standard deviation from the estimated long‐run ‘equilibrium’ real exchange rate).
The RBA was quick to caution however that the alternative approaches largely confirm that there is a substantial degree of uncertainty in producing estimates of under or overvaluation. That is, if its preferred model is estimated over a substantially longer (starting in 1971) or shorter (starting in 2002) period, the current level of the exchange rate is estimated as being between 18 per cent undervalued (1 standard deviation) and 14 per cent overvalued (1½ standard deviations).
The RBA concluded however that currently, the high AUD is “…probably a bit above the level justified by fundamentals, given the recent decline in the terms of trade and deterioration in the global economic outlook. However, it is not clear that the A$ is substantially overvalued…” because “…the terms of trade still remain high, despite having fallen by more than 10 per cent..” noting “…that this fall has been exacerbated by the unwinding of the effect of natural disasters on Australian export prices (most notably coal prices).”
As Westpac Currency Strategist Robert Rennie explains “What those fair value models don’t do is include one off very significant exogenous events like the fact that the vast majority of the world’s central banks have embarked on this incredible monetary and quantitative easing process. That is going to mean fair valuation models are going to deviate significantly from the reality of what we have to live with”.
The Big One
Although terms of trade is the key driver of exchange rates from a theoretical macroeconomic approach, the living reality today is that unprecedented monetary and quantitative easing in US, Japan and Europe have left Australia with the only AAA rated currency with a cash rate of 3.00%.
Indeed there are only four other AAA rated currencies in the top 10 most traded currencies, however their cash rates range from 0.25% to 1.00%.
The table below outlines the world’s most traded currencies (by value), and highlights the attractiveness of the highly rated AUD as an investment option for foreign central banks, sovereign wealth funds and institutions. Australia’s closest competitor in these terms is Norway with its AAA rating and central bank cash rate of 1.5%, but it ranks as only the thirteenth most traded currency, making it more difficult for the vast sums of international reserve funds chasing highly rated yields, to get set in that currency.
Worlds Most Traded Currencies By Value
| Rank | Currency | Percentage of Average Daily Market Turnover* | Central Bank Cash Rate | Credit Rating |
| 1 | United States USD ($) | 84.90% | 0.25% | AA- |
| 2 | European Union EUR (€) | 39.10% | N/A | N/A |
| 3 | Japan JPY (¥) | 19% | 0.01% | AA- |
| 4 | United Kingdom GBP (£) | 12.90% | 0.05% | AA+ |
| 5 | Australia AUD ($) | 7.60% | 3.00% | AAA |
| 6 | Switzerland CHF (Fr) | 6.40% | 0.25% | AAA |
| 7 | Canada CAD ($) | 5.30% | 1.00% | AAA |
| 8 | Hong Kong HKD ($) | 2.40% | 0.60% | AAA |
| 9 | Sweden SEK (kr) | 2.20% | 1.00% | AAA |
| 10 | New Zealand NZD ($) | 1.60% | 2.50% | AA+ |
| 11 | South Korea KRW (?) | 1.50% | 2.75% | AA- |
| 12 | Singapore SGD ($) | 1.40% | 0.04% | AAA |
| 13 | Norway NOK (kr) | 1.30% | 1.50% | AAA |
| 14 | Mexico MXN ($) | 1.30% | 4.00% | A- |
| 15 | India INR (INR) | 0.90% | 7.75% | BBB- |
| Other | 12.20% |
*Note: As two currencies are involved in each transaction the sum of the percentage shares of individual currencies totals 200% instead of 100%. Adjusted for local and cross-border inter-dealer double-counting (ie “net-net” basis).
The currencies ranking ahead of the AUD in terms of volume: USD, Euro, GBP and Yen; are all economies mired in record government debt levels (ranging from 102% to 220% of GDP), which cannot be turned around for decades. Indeed, with such massive existing debt levels, governments and central banks in these economies must keep their interest rates at very low levels to ensure their own debt serviceability. The AUD attractiveness as a secure relative investment option is therefore established for the long run in these terms.
Concluding Comments
The current strength of the AUD is rooted in solid economic fundamentals. Australia looks set to achieve GDP growth of 3% over 2013, the outlook for commodities prices remains steady and underpinned by long term structural demand factors, and inflation, government debt levels and unemployment are all low. In comparison, the outlook for US growth is benign with unemployment and government debt at very high levels.
The AUD appeal as an investment option is obvious when its AAA credit rating and high cash rates are compared to alternate options available to reserve funds, which simply must be invested somewhere. This investment appeal is also not a short term factor, as government debt in the key investment currencies remains at record (and growing) levels.
All of these factors indicate the AUD will remain strong for the foreseeable future. That strength will subsist until either the Chinese population stops wanting to urbanise (a factor that has never happened before in the history of urbanization processes), or the US, Europe, Japan or Britain increase interest rates substantially (which would cause them at this point to become insolvent). Consensus projections of strength in the AUD into the medium term (at USD parity or above until at least 2017) therefore seem assured.

